What is PTGL?
Previous section
Step-by-step guide
Download this guide as: [PDF].
Table of contents
- Protein and Folding Graph of a PDB ID
- Search proteins by their linear notation
- Search structures containing a predefined motif
- Advanced search
- Complex Graph of a PDB ID
1: Protein and Folding Graph of a PDB ID
First, open the PTGL website under http://ptgl.uni-frankfurt.de. You will see this page:
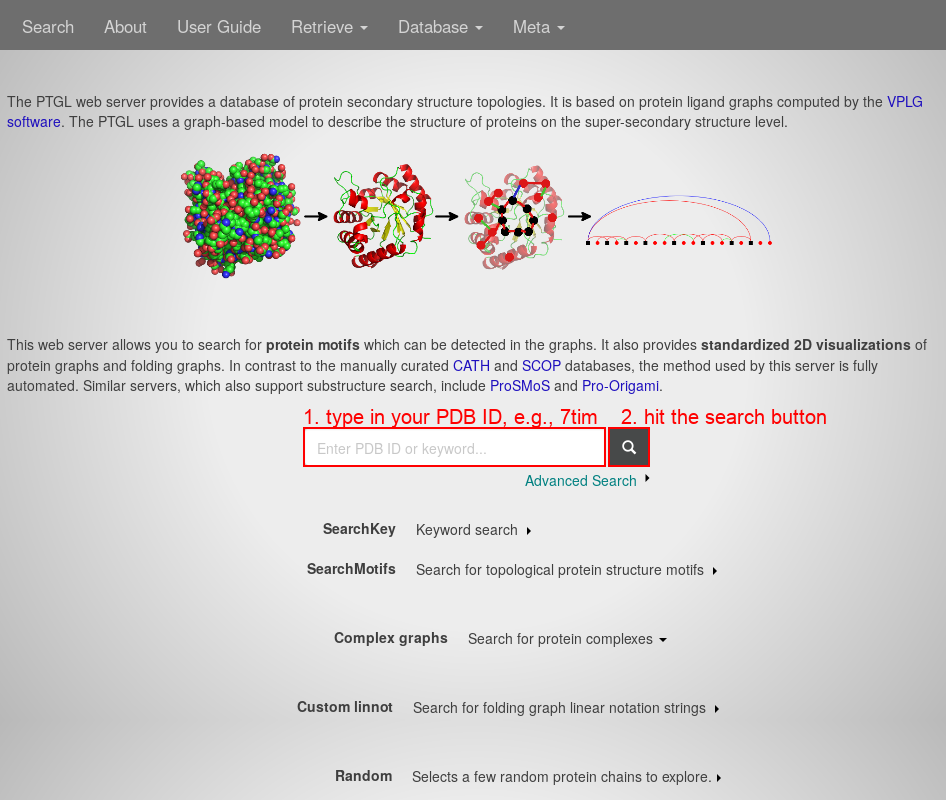
- In the center search field, type in your PDB ID, e.g., 7tim.
- Hit the "search" button. You will see a list of chains:
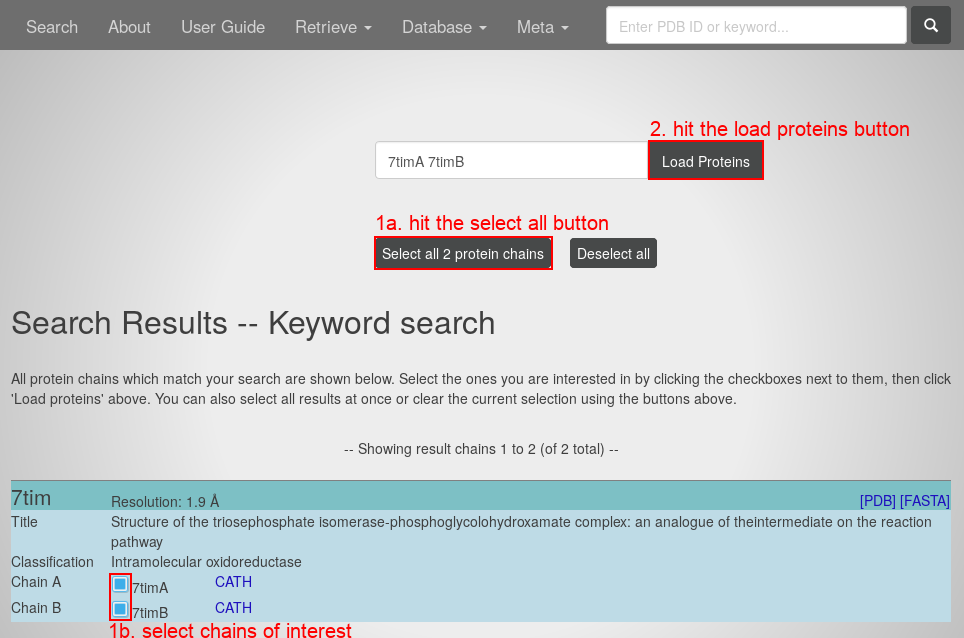
- Either hit the "select all protein chains" button or select the chains of interest by their check boxes in the list at the bottom.
- Hit the "load proteins" button. You will see the Protein Graph of the first selected chain:
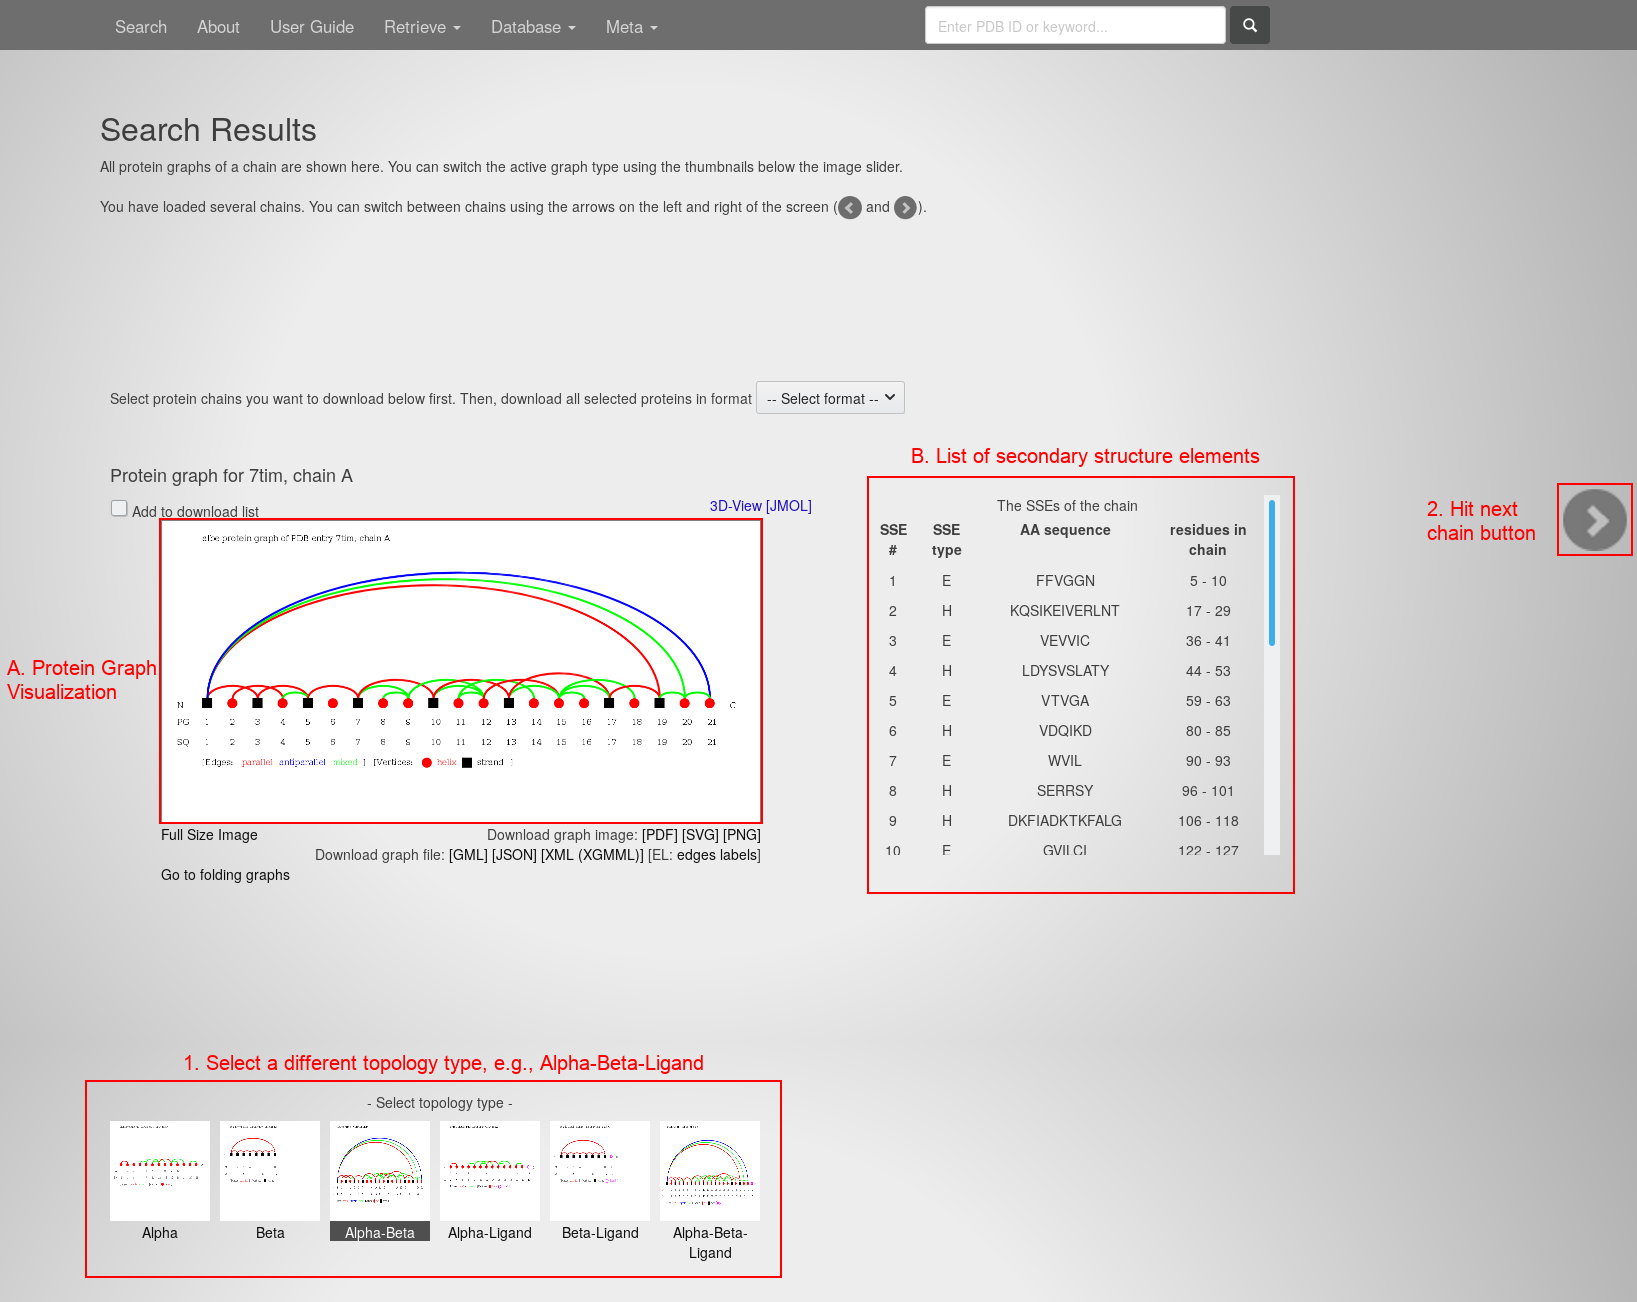
The page contains:
- The Protein Graph Visualization in the center.
- The list of contained secondary structure elements on the right.
- Select the alpha-beta-ligand topology type at the bottom. The image slides to the respective visualization.
- Hit the "next protein chain" button in the center of the right edge. The page slides to the respective protein chain:
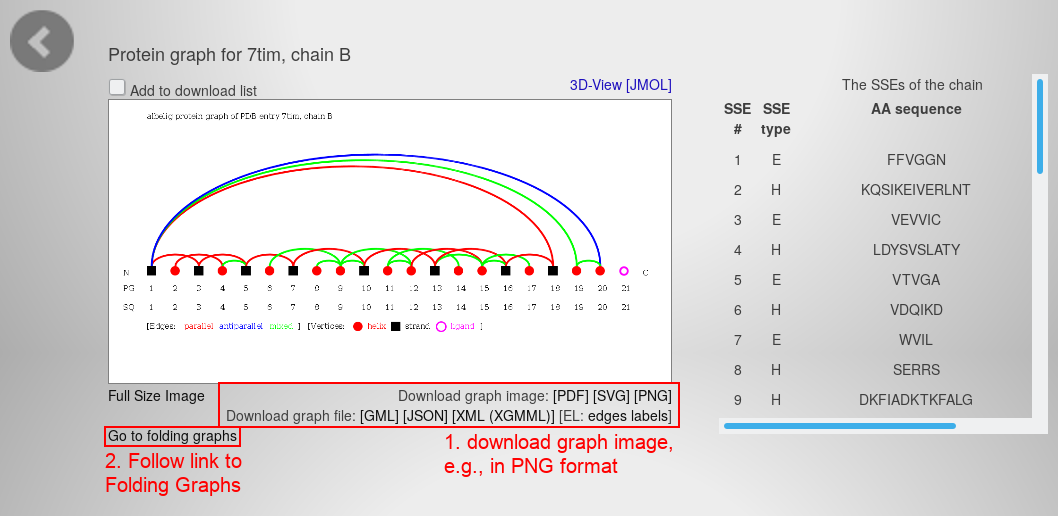
- Download the graph visualization as PNG file with the link beneath the image.
- Follow the link beneath the visualization on the left to open the Folding Graphs of this chain. You will see this page:
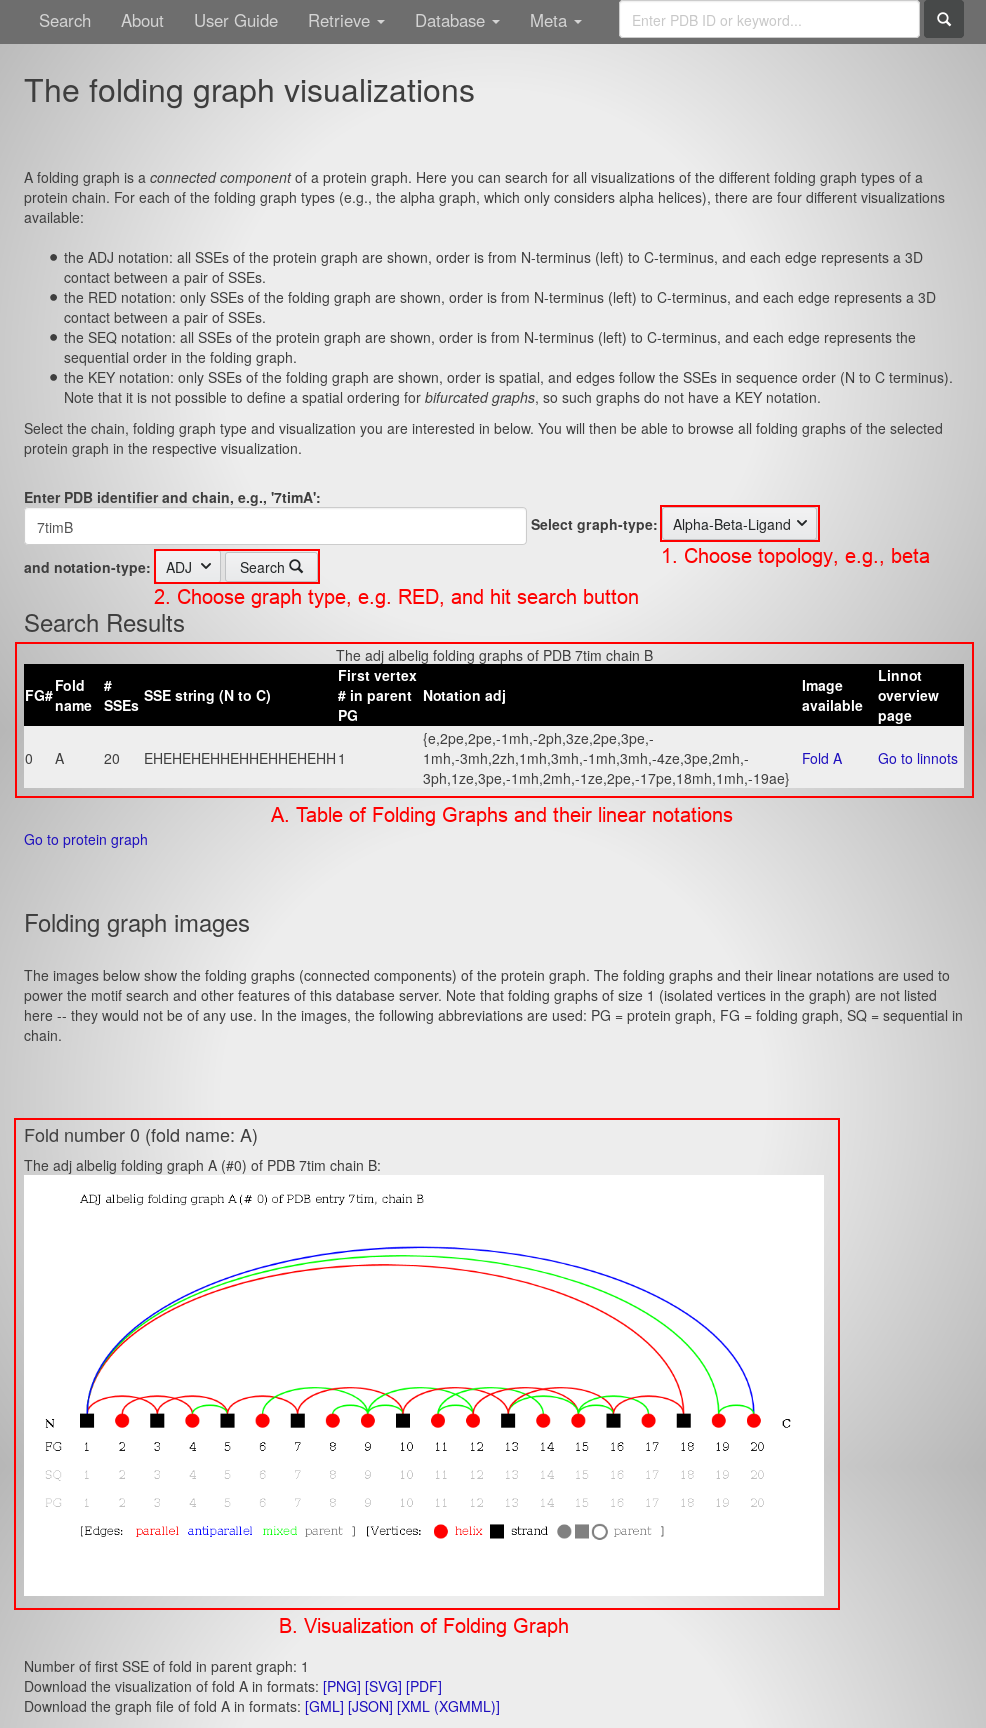
The page contains:
- A table of all Folding Graphs for this chain in the center. For each Folding Graph, it lists the Folding Graph number (FG#), fold name, number of secondary structure elements (#SSEs), the sequence of secondary structure elements from N- to C-terminus (SSE string), the vertex number of the first vertex in the parent Protein Graphs (PG), the linear notation, a link to the graph visualization and a link to the overview of the linear notations (linnot).
- The Folding Graph visualization at the bottom.
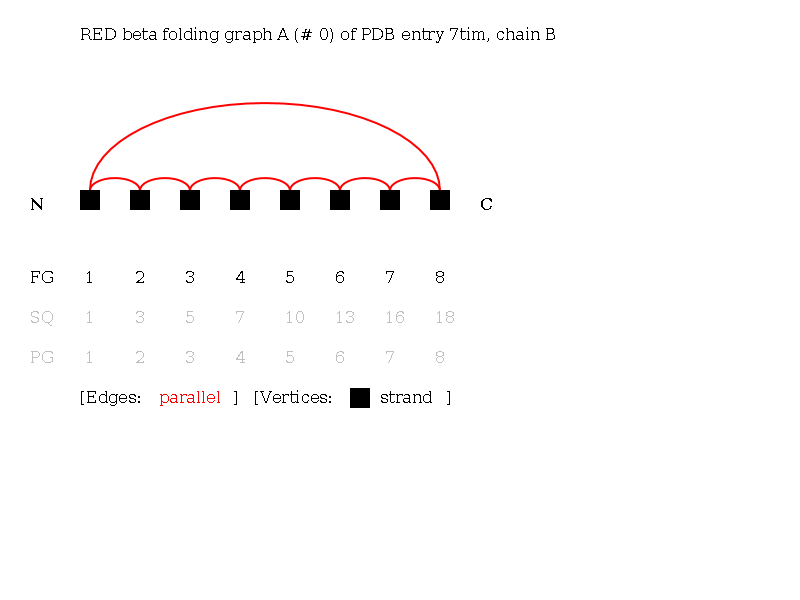
- From the graph-type drop-down menu, choose the beta topology.
- From the notation-type drop-down menu, choose the RED notation.
- Hitting the "search" button you will see the page containing this graph visualization:
2: Search proteins exhibiting a structural topology by their linear notation
Open the PTGLweb website under http://ptgl.uni-frankfurt.de. You will see this page:
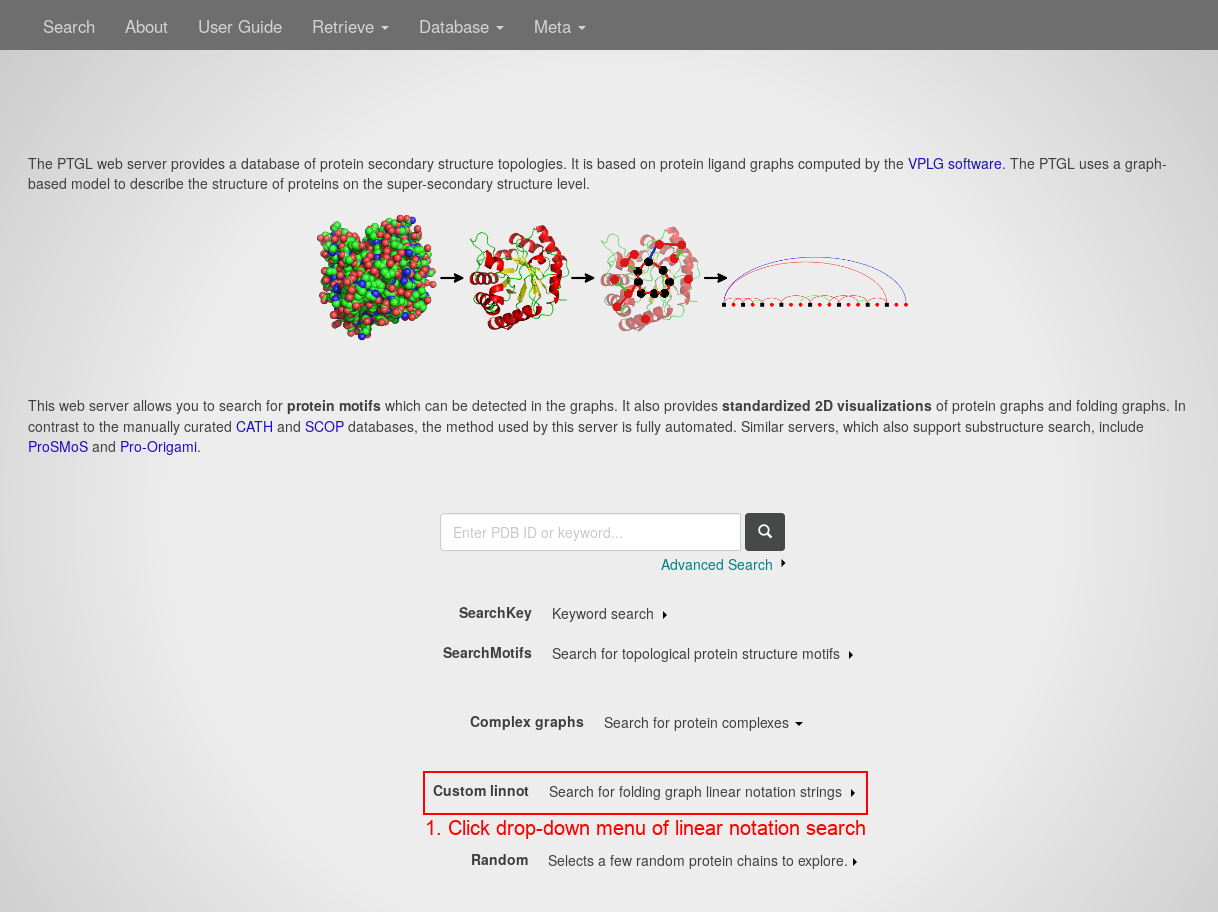
- Open the drop-down menu of the linear notation search by clicking anywhere on the respective line.

- In the notation-type drop-down menu, choose reduced (RED).
- In the graph-type drop-down menu, choose beta.
- Type '(1a,1a,1a,1a,1a,1a,1a,-7a)' in the search field.
- Hit the "search" button.

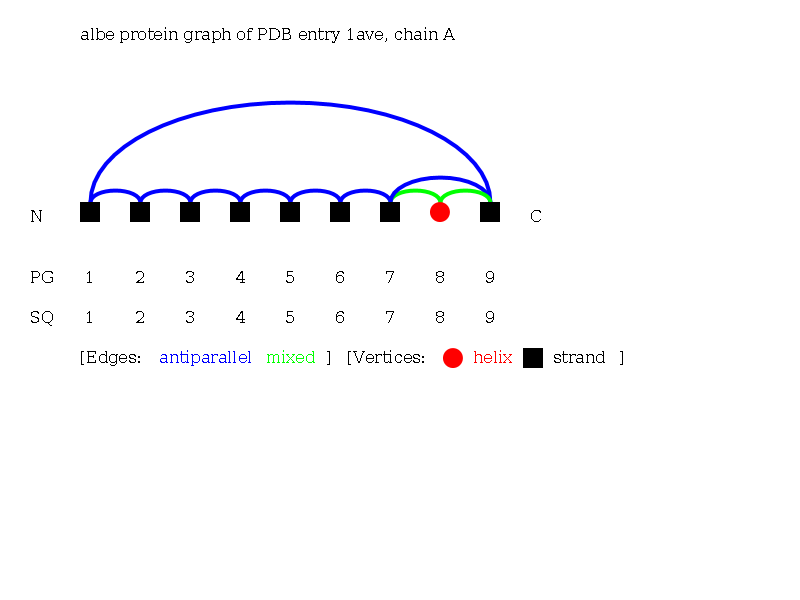
- Select the protein chain 1aveA by clicking the respective check box.
- Hitting the "load proteins" button you will see the page containing this graph visualization:
3: Search structures containing a predefined motif
Open the PTGLweb website under http://ptgl.uni-frankfurt.de. You will see this page:

- Open the drop-down menu of the motif search by clicking anywhere on the respective line.
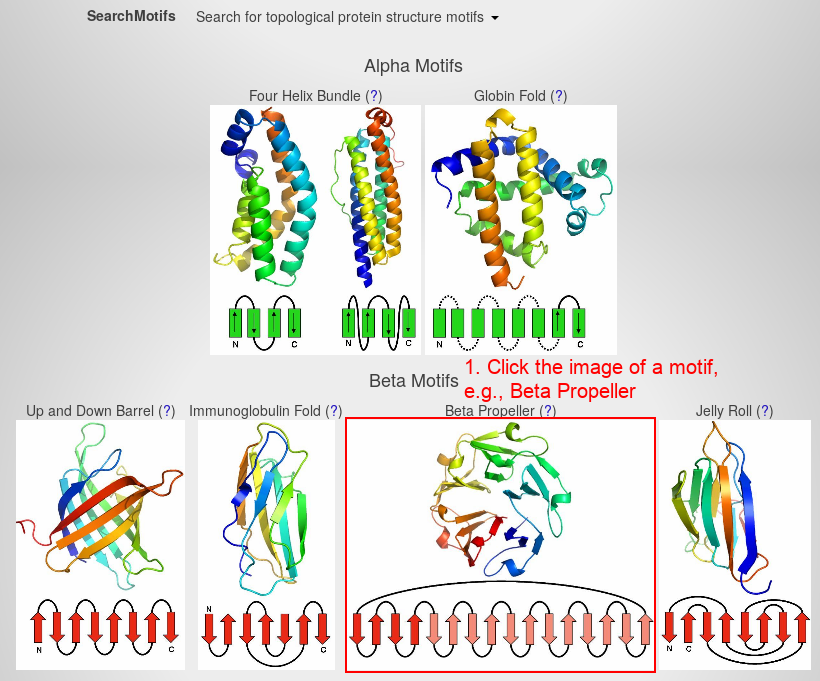
- Search for the beta propeller motif by clicking on the respective image.

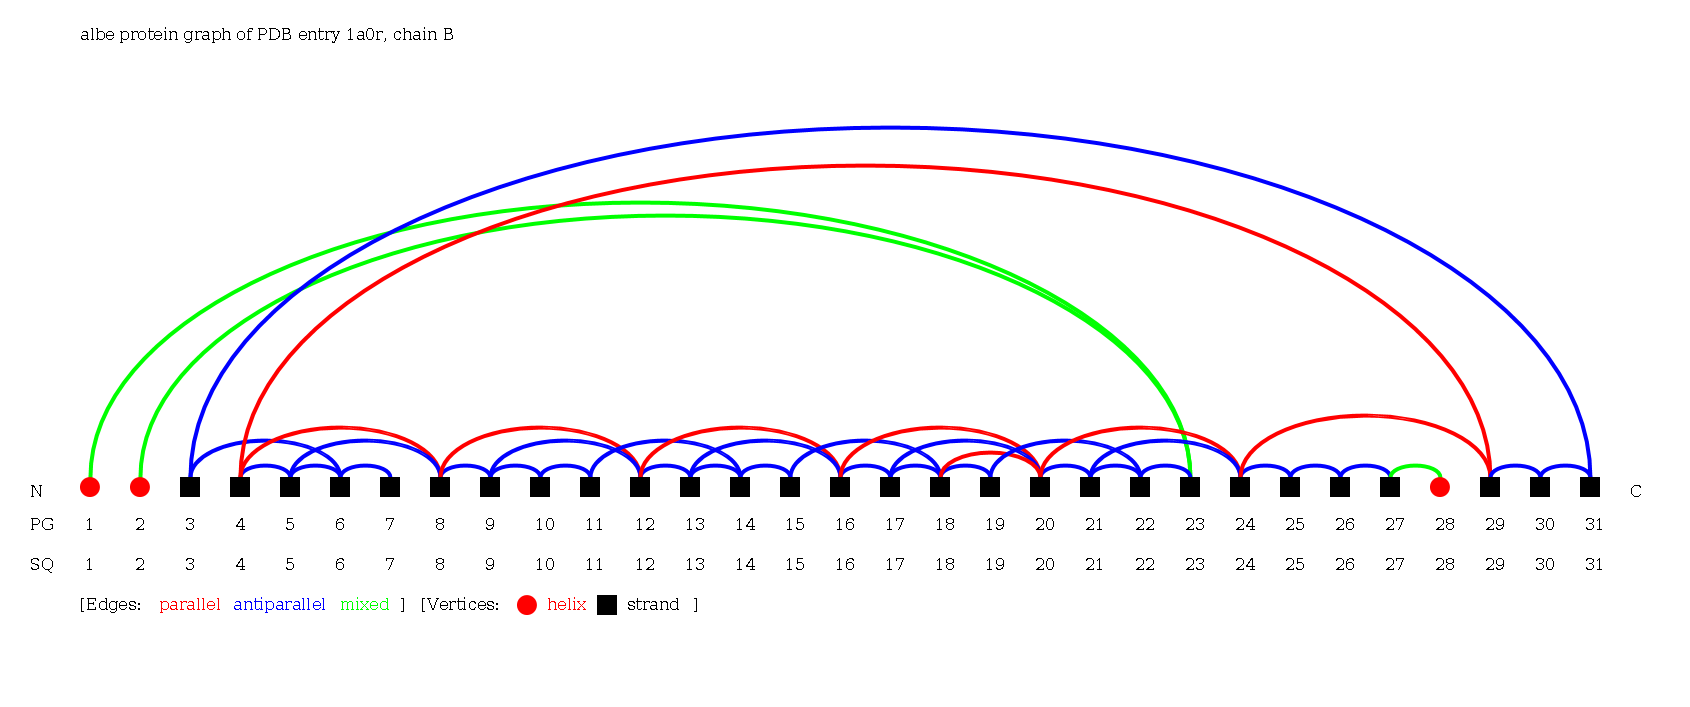
- Select the protein chain 1a0rB by clicking the respective check box.
- Hitting the "load proteins" button you will see the page containing this graph visualization:
4: Advanced search
First, open the PTGL website under http://ptgl.uni-frankfurt.de. You will see this page:

- Open the drop-down menu of the Advanced Search by clicking anywhere on the respective link.
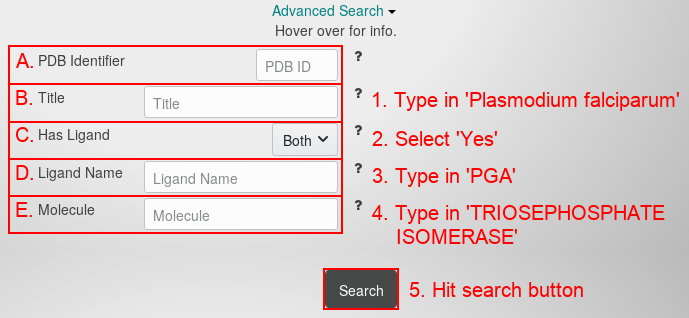
The drop-down menu contains the following fields:
- The 4-character PDB identifier (ID). Using this field is the same as using the main search field. Combining this field with other advanced search fields makes no sense, because a PDB ID already unambigously identifies a protein structure. Using this field may still be useful, because it only searches for the PDB ID and on the contrary to the main search field neglects key words.
- The author-chosen title of the PDB entry. The title often contains the name of the experiment, of the protein or of the source organism. The search finds titles containing the entered text.
- Choose whether the protein should include a ligand or not. Water is not treated as ligand.
- The ligand name. The search finds results for the 3-character ligand code from the PDB or parts of the ligand full name.
- The molecule name. The search finds results for the molecule / chain names of the PDB entry.
- Type 'Plasmodium falciparum' in the title search field.
- Choose 'Yes' from the ligand drop-down menu.
- Type 'PGA' in the ligand name search field.
- Type 'TRIOSEPHOSPATE ISOMERASE' in the molecule search field.
- Hit the "search button". You will see this page:

All the presented protein chains apply to the criteria of your Advanced Search. Now:
- Hit the "select all protein chains" button.
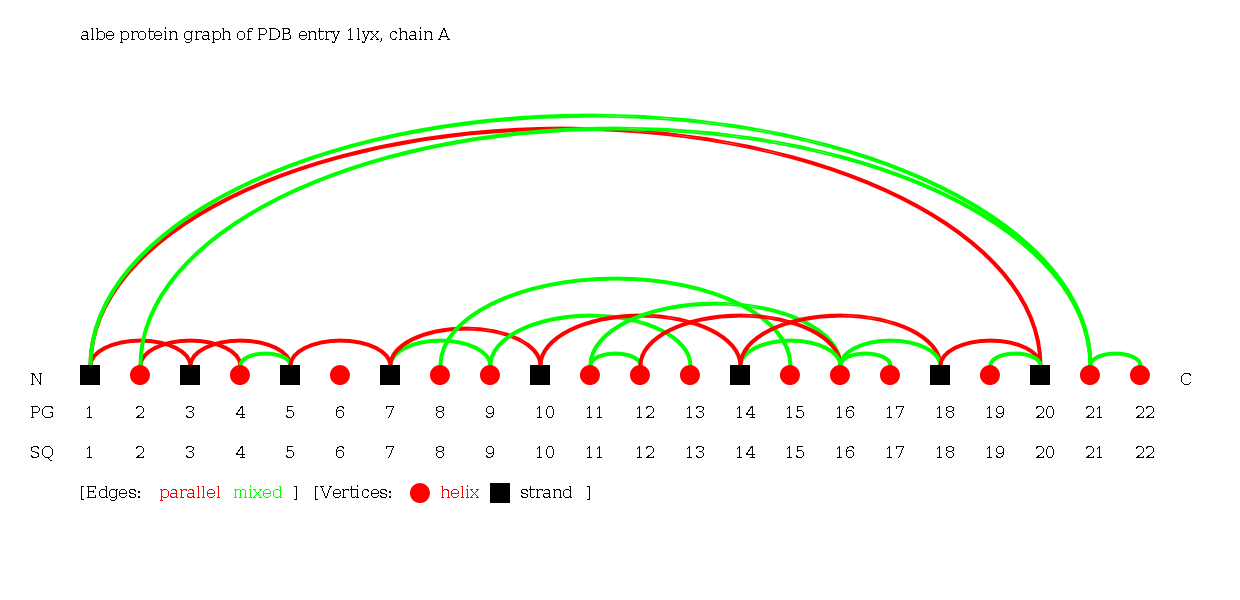
- Hit the "load proteins" button. You will see the page containing this Protein Graph:
5: Complex Graph of a PDB ID
Open the PTGLweb website under http://ptgl.uni-frankfurt.de. You will see this page:

- Open the drop-down menu of the Complex Graph search by clicking anywhere on the respective line.

- Type in the search field the PDB ID 6ebl.
- Hitting the "search" button, you see this page:
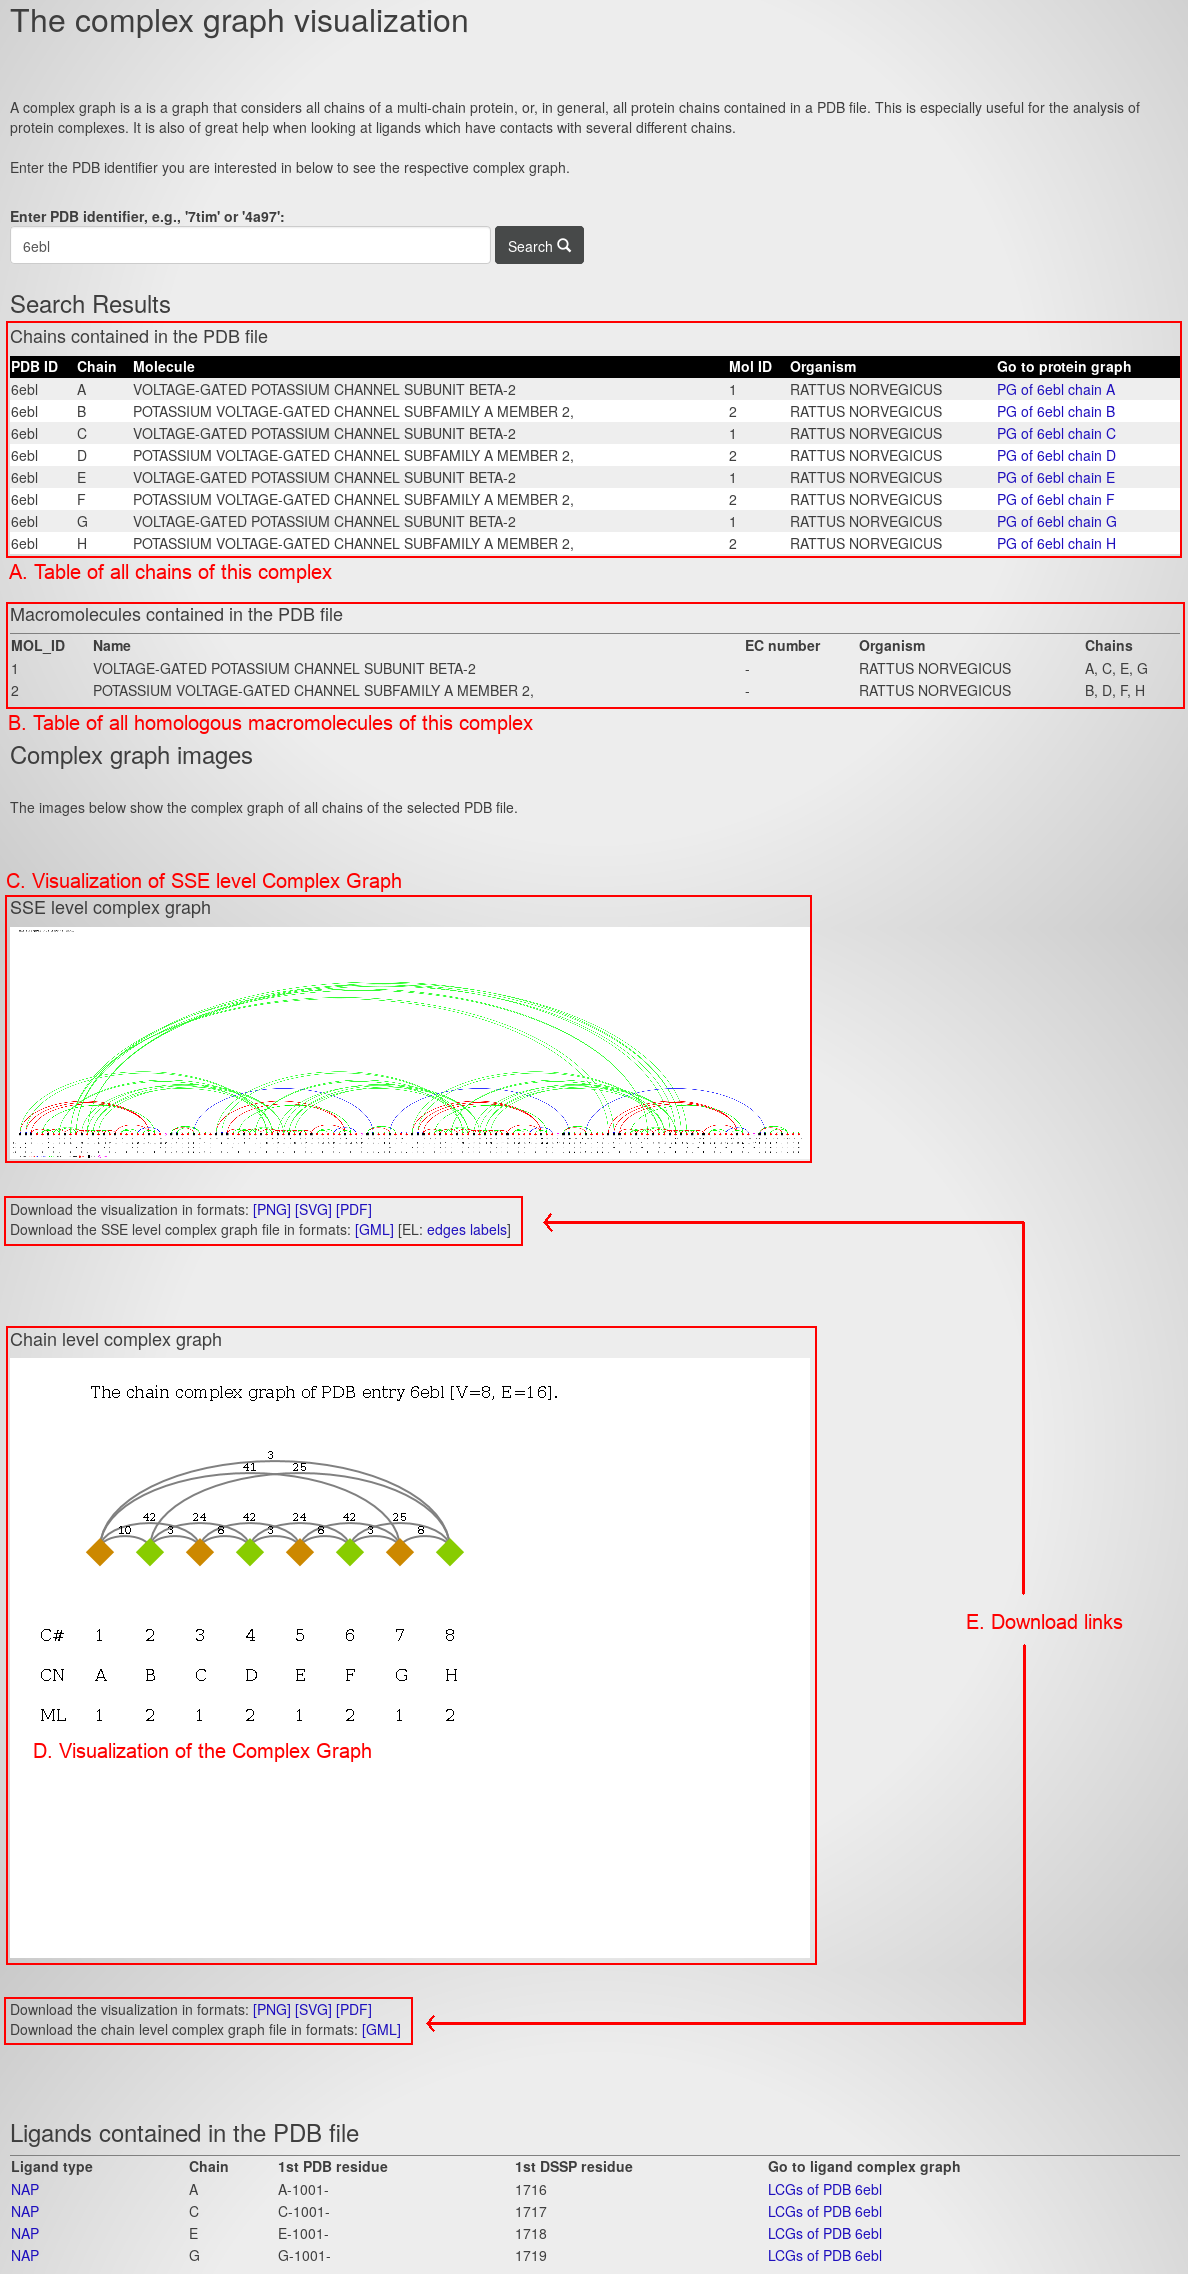
The page contains the following information:
- A table of all chains of this complex. For each chain, it lists the PDB ID, Chain ID, Molecule name, Molecule (Mol) ID, source organism, and a link to the Protein Graph.
- A table of all macromolecules of this complex. For each macromolecule, its lists the macromolecule ID (MOL_ID), the name, the enzyme class (EC) number, the source organism and the homologous chains.
- The visualization of the secondary structure-level Complex Graph. It corresponds to a Protein Graph extended by all secondary structure elements of the complex.
- The visualization of the Complex Graph.
- The download links for the graphs and their visualization in different file types.
Next section
Biomedical examples